We are all humans, and those who get sick need a health care. Health care in US is terribly expensive. One of the most expensive across the entire world. This is why health insurance is an important condition for doctor’s visit. Recently, there were plenty of discussions about Affordable Care Act (ACA, also known as ObamaCare) and American Health Care Act (AHCA or TrumpCare) which may replace ACA. It is important to know, that both initiatives are about money, not about insurance or health care itself. At this time, I would like to leave AHCA aside, since it is still under discussion by Congress. Meantime, ACA has been under severe scrutiny by republicans for a while. Does “repeal and replace” slogan sound familiar? I did not use any provisions from ACA, since I use employer’s insurance. But I wanted to build some opinion about ObamaCare, to share this info with those who need it now and to compare the upcoming ACA replacement with ObamaCare later.
In order to collect the data, I used Covered California for California state and healthcare.gov for other states (in particular, Oregon and Nevada). I was looking for insurance premium as the most important metric, since these are money we pay every month for insurance, no matter what. There are two opposite sides: minimal insurance premium, which often comes with high deductible, and small (or non-existent) deductible which obviously comes with higher premium. Also, I consider Health Maintenance Organization or HMO insurance (it happens to be Kaiser in both California and Oregon along with Health Plan of Nevada and Prominence in Nevada), opposite to Preferred Provider Organization or PPO (which comes from insurance such as Blue Shield in California, Athem Blue Cross in Nevada, BridgeSpan and Moda in Oregon).
First of all, I reviewed the details about available health insurance at San Jose, CA. I considered the age of insured individual between 40 and 60, and the income varying from $30K to $40K per year. Why did I choose this range? Because if you are not super rich, and worked as an employee at corporation for extended period (opposite to your own business), then most likely you end up with this amount of income at the voluntary retirement event. But if your income fall below 138% of the Federal Poverty Level (FPL), then most likely you can qualify for traditional Medicaid program or its expanded version. Some states signed up for Medicaid expansion, which cover people too poor to buy insurance, but not eligible for traditional Medicaid. Currently, 31 states including AZ, CA, CO, MD, MA, NV, NY, OR, PA, WA as well as DC expanded Medicaid.
In California, in order to be eligible for Medical (State’s Medicaid program providing free or reduced cost health care), you have to be between 19 and 64 years old, with adjusted annual gross income at or below $16K for an individual and $22K for a couple. Also, people older than 65 can qualify, if they are blind or disable. In addition to that, the qualification includes asset test. Current income limit is $1188 per month for an individual and $1603 for a couple. Asset limit is $2000 for an individual, or $3000 for a couple. The following assets are excluded: a primary home, one vehicle, household items, belongings, life insurance policies and the balance of pension funds, IRA and certain annuities. One of the important ACA provisions is the expansion of Medical eligibility to pretty much all low income individuals with the income at or below 138% of FPL. Medical is covering pretty much all essential services, but pays doctors lower rates and by that reason not all doctors accept Medical. Apparently, those who does not qualify for Medical and too young to qualify for Medicare, must be either insured through the employer or buy ACA insurance at the market exchange.
No surprise, in most cases the premium price is rising with the age: the greatest increase appear to be for Blue Shield Gold plan with no deductible: about 3% each year, with total around 30% in ten years from 50 to 60, for person who earn $30K per year. There are fewer subsidies available for those earning $40K per year, and Blue Shield Gold premium increase is less significant: about 26% per ten years. Which clearly indicates, that subsidies are shrinking with the age, especially for those between 50 and 60 years old. Surprisingly, Kaiser insurance premium actually drops over the years with Bronze plan, and remain almost the same for Gold plan with no deductible. The premium increase with age for Bronze PPO plan and high deductible is almost invisible: a few percents over ten years.
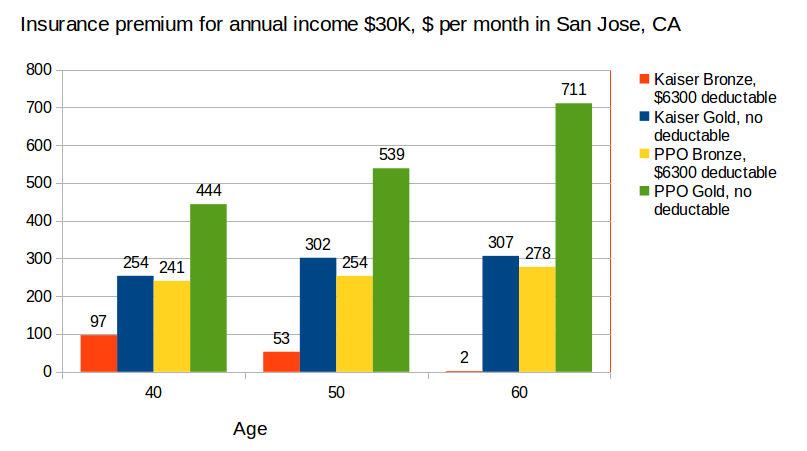
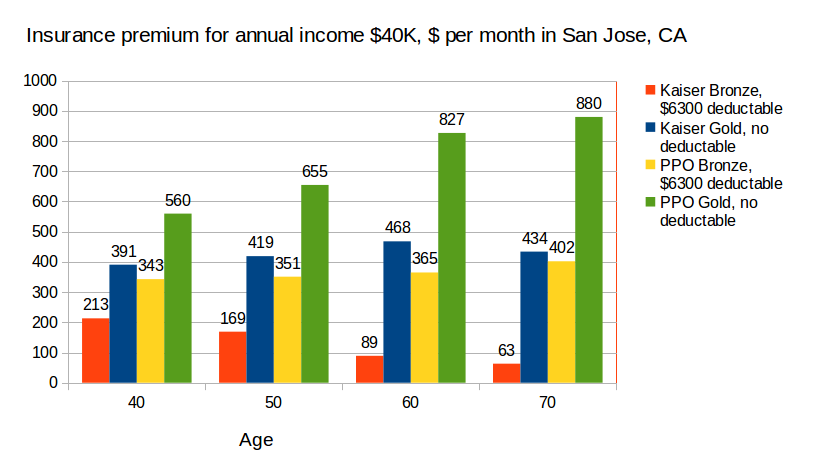
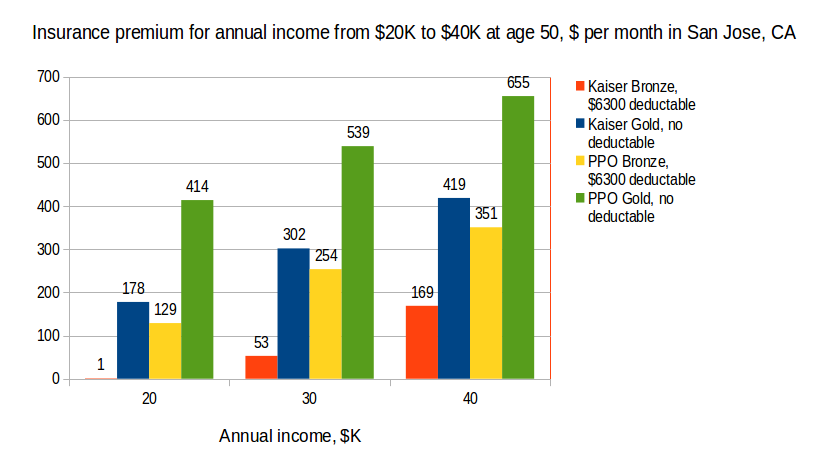
It is clear from diagrams above, that annual income affects the amount of insurance premium. According to the current ACA rules, people with lower income receive more subsidies, than people with higher income. But how much is the difference? I found, that the premium cost from various providers is changing dramatically with the income, with the starting points and rising rates quite different across the plans and providers. Extremely sharp growth observed for Kaiser Bronze plan from $53/mo for $30K income to $169/mo for $40K income. Meantime, the cost of Kaiser Gold and both PPO plans with no deductible doing the opposite, i.e. rising sharply for lower income below $30K and less significant for income above $30K.
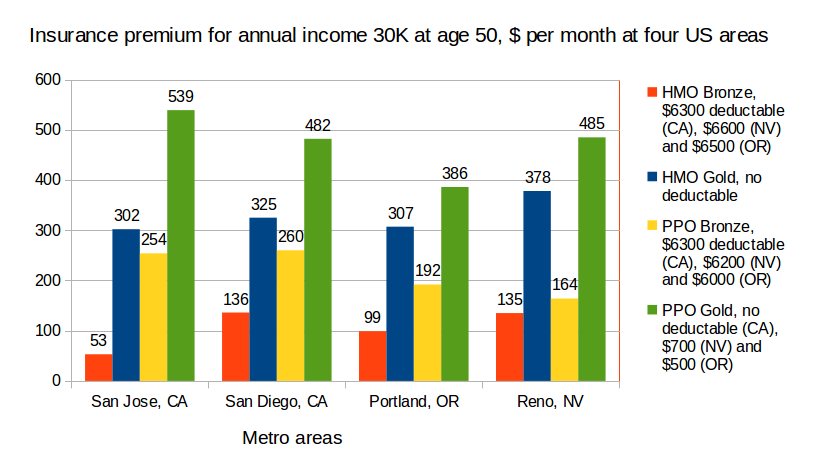
Another question I had in mind: how the state and metro area affects the insurance premium? For that purpose, I verified at least four different metro areas: San Jose, CA, San Diego, CA, Portland, OR, Reno, NV. Surprisingly, the cost of insurance does not always follow the cost of living, as the highest cost of living is obviously in San Jose, CA followed by San Diego, Portland and Reno. In fact, the highest cost of HMO Bronze plan is observed in San Diego and Reno, while the highest cost of HMO Gold plan appears to be in Reno, NV. The highest cost for all HMO plans is in Reno, NV, while the cost of PPO plans is higher in California. For three out of four plans, you can buy the least expensive insurance in Portland, OR.
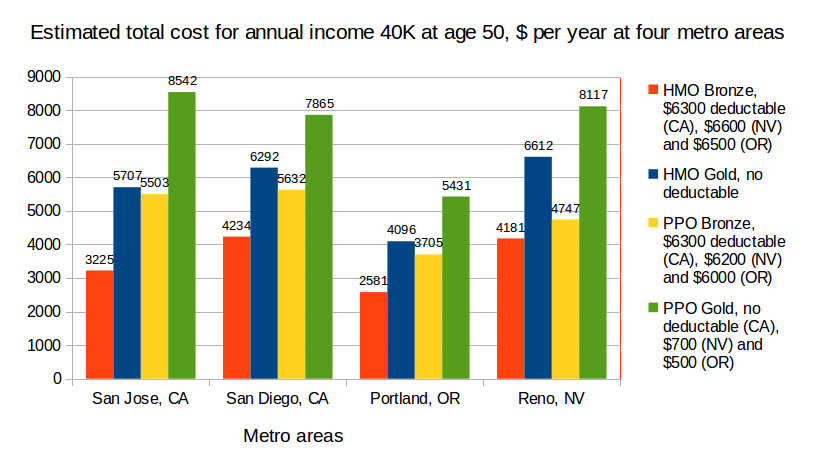
We can see a very similar trend for the person with annual income $40K (compared to $30K) at the same age of 50, except may be HMO Bronze plan: with the annual income on the rise, the least expensive plans are clearly in Portland, OR, while the highest cost is split between San Jose, San Diego and Reno.
In this article, just four metro areas has been discussed. There are too many data to compare across the entire country. But another observation easy to make is that offerings on the ACA market exchange is dramatically different from one state to another. While in major metro areas of California and Oregon there is a choice of up to 30 different plans, the areas like Las Vegas, NV, Phoenix, AZ does not have much choice at all, beyond a few unattractive HMO plans. Even for some populated areas of California, for example San Luis Obispo the choice is still limited by 10 PPO plans, represented by Blue Shield of California and Anthem Blue Cross. It means that you really must live in a major metro area of selective states, in order to obtain reasonable coverage under ACA.
Apparently, all discussed above is going to change as soon as next year in one way or other, because of the AHCA being discussed in Washington DC and various alternatives proposed at the states level: Healthy California Act, New York Medicare for All initiative, Nevada’s Medicaid for All healthcare model. While all these initiatives has a significant support in respective states, it is still unclear how to fund them, taking into account the plans of Trump’s administration to cut Medicaid funds and eliminate ObamaCare provisions (including Medicaid expansion). But it is clear that some healthcare system will be in place in US for coming years, and it would be interesting to compare the above data to the alternative solution, which suppose to be better than the previous one.
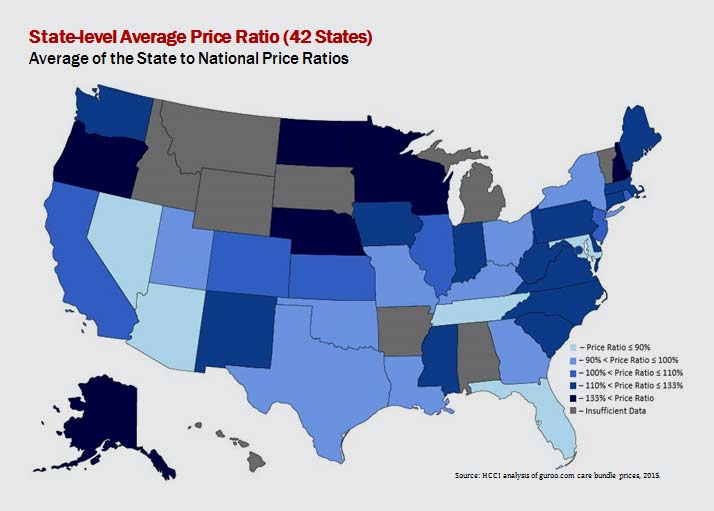
Finally, I wanted to share this excellent map, created by Health Care Cost Institute in 2015. Since that time, obviously the cost went up in most states, but according to my observations the health care cost distribution across different states remain the same. According to the map, the lowest state to national average price ratio is in the states of Nevada, Arizona, Florida and Tennessee, followed by California and Oregon (which is apparently one of the most expensive across all states). But please keep in mind, that these data account for the total cost across all insurance plans including those sponsored by employer (not just insurance premium for ACA), which explains the difference with the data published above.
