

Dividend investing has always been a widely discussed topic. It gained more popularity lately, due to the current market conditions. There might be strong opinions people express in favor or against it. I wanted to focus on some basic ideas here which may help someone to make a right investment decision.
First of all, there are two investment strategies which may actually complement each other: growth and income. When it comes down to equities, investing for growth means buying and holding stock which likely will grow in price. The time of sale is up to investor. This is great, because it is possible to plan ahead for the sale event. However, growth stock may also lose its value and it is hard to predict. Therefore, the revenue stream provided by growth investments can be uneven and sometimes non-existent for a relatively long time. FAANG stock (Facebook, Amazon, Apple, Netflix, Google) would be a good example for growth investment opportunities.
Investing for income means buying and holding stock which produce income on regular basic. Some people may say there is a magic involved. Apparently, there is no magic: dividend is just a part of revenue companies pay based on their results. Investor cannot control when dividend is paid. It is up to the company to set up a schedule. As a result, investor may face severe tax implication or experience income drop at some time. Still, dividend income is much more predictable than growth income because it is paid regularly. Dividend stream can be stable even under critical market conditions, when stock market is down. AT&T can be an example of stock paying dividend for a long time.
The important number to measure investment rate of return is annual percentage yield (APY) which is the actual rate of return during the year. With respect to dividend stock, it is a dividend yield or amount of money company pay to shareholders for owning the stock. This can be a real number (dollar amount paid per share) or percentage number (amount paid per share divided by current share price). The typical dividend value can be as low as 0.1% or as high as 15%. However, most stable companies pay around 1-4% with utility and staples sector paying higher dividend while REIT (Real Estate Investment Trust), MLPs (Master Limited Partnership) and BDCs (Business Development Companies) may have even higher dividend payments, but they are also taxed at higher rates.
Individual stock is not the only way to invest. In fact, it is hard to pick the right stock which will provide a guaranteed income in the future. Mutual funds and/or ETF can bring more opportunities for inexperienced investors. Although they may not have the same benefits as stock individually selected, funds provide greater exposure to broader investments range and less risk to lose money. While ETF like VUG can be a great example for growth investment, VYM is a high yield dividend income ETF and VTI is a total market index ETF which apparently track both growth and dividend stocks. Let us compare these popular Vanguard ETFs, to understand the difference between growth and income strategies. Portfolio visualizer is a great tool to figure out what is going on with stock price, total return and income over the time.
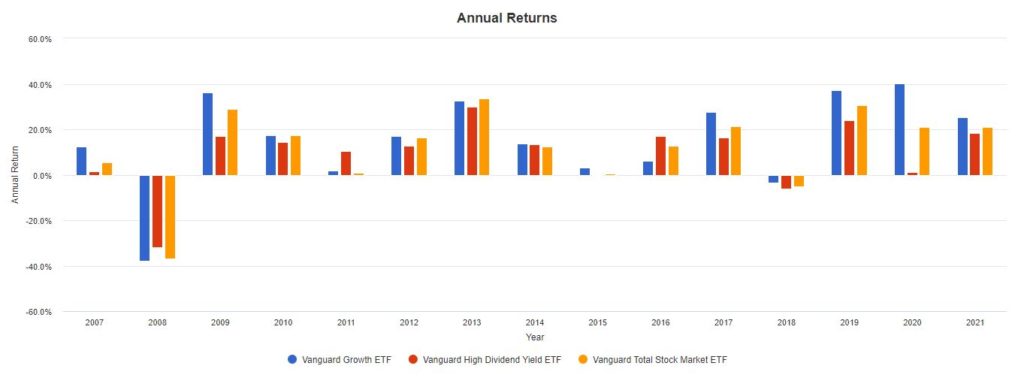
As expected, growth ETF (in blue) show the highest return in many cases, while dividend ETF (in red) tend to have the lowest return. Total market ETF (in yellow) is in between. Again, as anyone would expect annual return is not stable and in fact exhibit substantial losses at the time of recession (2008). But we can see a quite different picture when compare the annual income rather than annual return.
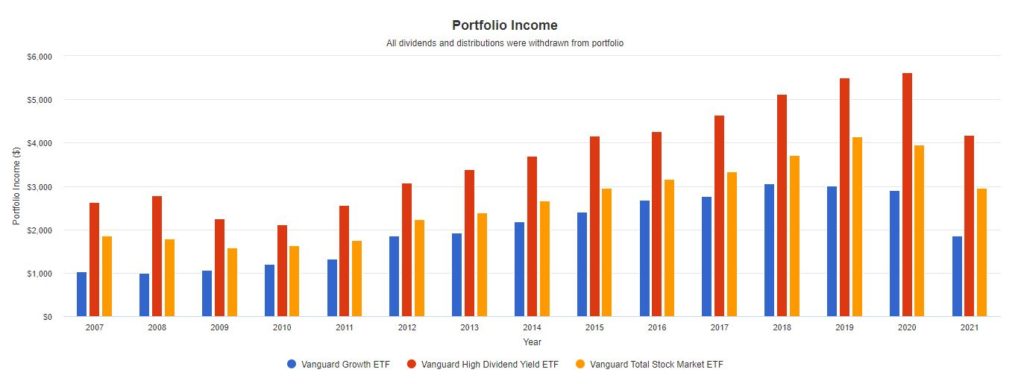
As you can see, the highest annual income is provided by dividend ETF (in red), while growth ETF (in blue) demonstrate the lowest income. Total market ETF (in yellow) again is in between combining advantages of both strategies. Although the income dropped quite a bit at the time of recession 2009-2010 (more than 50% of the highest income for reported years) it remains stable across all three ETFs and to some extent repeat each other. This is because all three are index ETFs tracking a broad range of stocks.
Apparently, there are plenty of high yield dividend funds or ETF to choose from: DGRO, VIG, NOBL, HDV, SDY, VYM, SCHD. Most of them (except NOBL and SDY) are passively managed funds, which means they are not expensive to own with expense ratio close to 0. Their performance varies depend on the choice of equities selected by fund or ETF managers. While the fund with the highest dividend yield is HDV (3.55%), the fund with the lowest yield is VIG (1.53%). Lower dividend in most cases means higher annual return, but there can be exceptions. According to analysts familiar with this matter SCHD provide the best combination of return and stable income over the time. It is supported by the graph we can obtain from Portfolio visualizer.
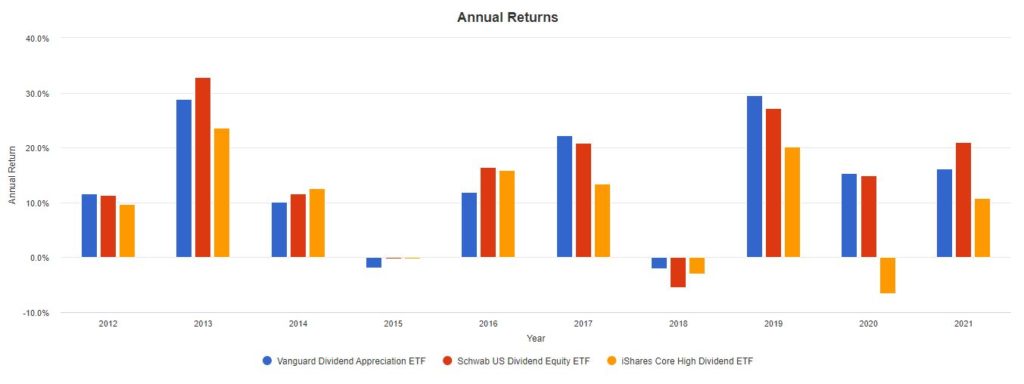
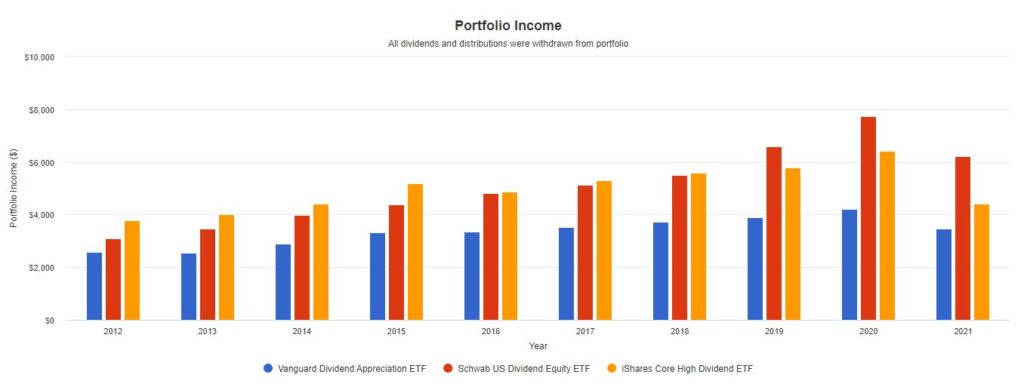
While HDV (in yellow) indeed has the lowest (sometimes negative) annual return among these three picks, SCHD (in red) does a good job competing with VIG (in blue) for annual return and at the same time providing dividend income similar or higher than HDV.
For the tax implication, it is also important to mention that dividends can be qualified and ordinary (non-qualified). Qualified dividend along with long term capital gain carries lower tax burden, which provide an advantage to hold in taxable accounts (compared to tax deferred accounts such as IRA). Both VYM and SCHD distribute qualified dividends only.
Since there are plenty of funds and ETFs providing stable dividend yield to investor, what would be the reason to pick individual stock? As already mentioned above, dividend yield for those funds rarely exceeds 3.5%. This is because a broad range of dividend stocks are selected, at both high and low dividend yield to sustain diversification and stable value for investor. With intelligent individual stocks selection, the yield can be improved up to 4-5% and even higher in some cases. What are the criteria to pick the right stock? There are various metrics which can be explored, including the ones listed here:
- Total return over certain time, to make sure it does not drop while dividends are being paid.
- Sector where company operates such as telecom, energy, health care, etc. Individual stocks must be diversified across the sectors to make sure they do not underperform all together.
- Analysts score, typically chosen as buy (strong buy), hold or sell.
- P/E (Price-to-Earning) ratio, compared to average P/E ratio for the sector: current share price relative to the earnings per share.
- Number of years dividend increased: there are dividend aristocrat stocks (65 as of 2021) which increased dividend during more than 25 years such as MMM, ABBV, CVX, etc.
How would the annual return and income graphs would look like for individual companies, compared to high yield mutual funds or ETFs? This is a snapshot of 25 companies paying dividends, with majority of them being dividend aristocrats.
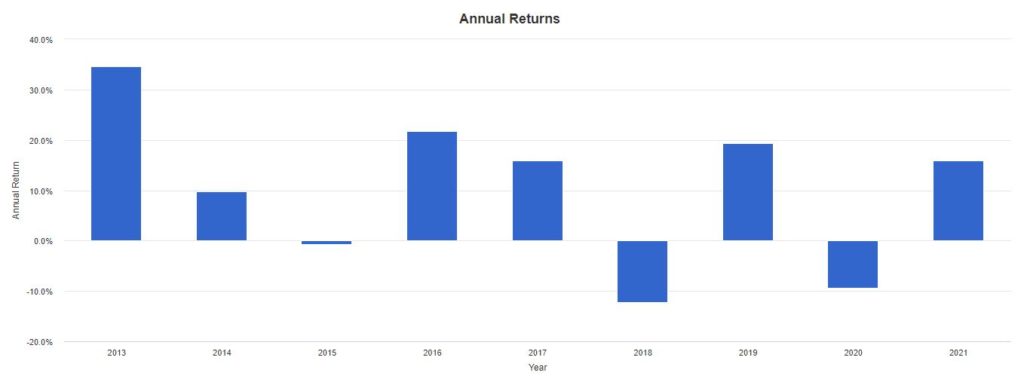
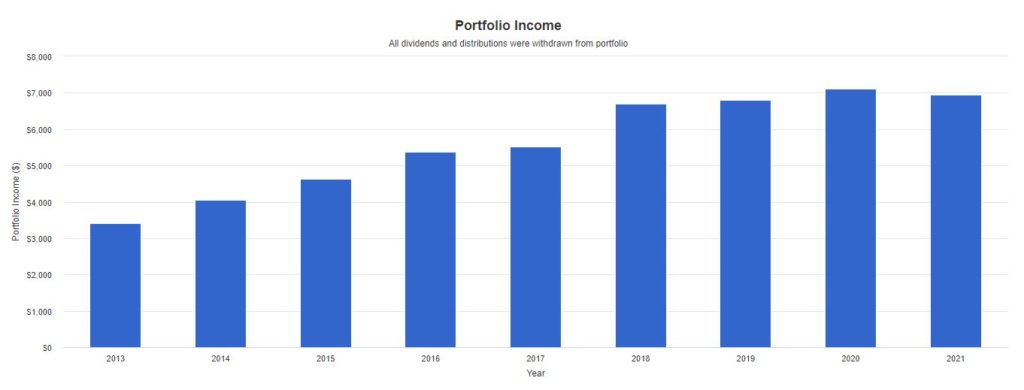
For the annual return, we have really unstable picture compared to ETFs. Indeed, individual stocks are always more volatile than the index across a broad range of stocks. However, annual income on the second graph looks nice and consistent with total value substantially higher than ETF increasing over the time.
Which strategy works better then? There is no simple answer for this question. It depends on investment goals, time horizon and other conditions. One can choose dividend income over the growth when regular money stream is more important than the gain in value. This could be actually true for some retirees who want stability over the high return. Lately, dividend investment become more popular because of the high inflation and low interest environment which makes bond investment less attractive. After all, dividend stocks are combining the best across equities and bonds making investment revenue more predictable yet producing measurable income.
Excellent article. I certainly love this website. Keep writing!
I needs to spend some time learning more or understanding more.